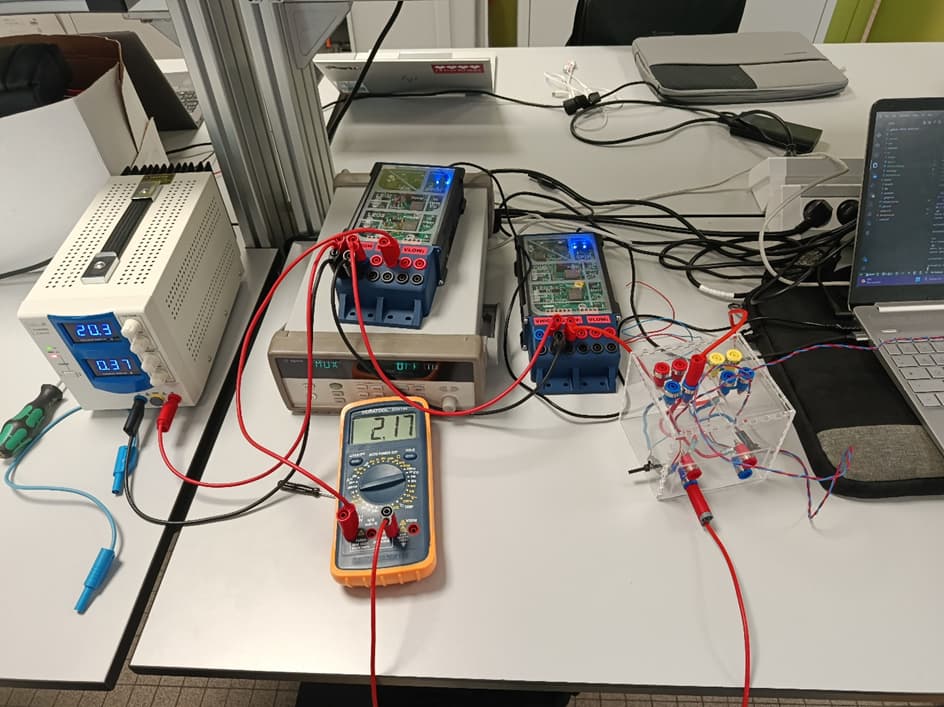
To ensure our automated system was reliable, we first validated the circuit manually. With 5A of current circulating, we used a standard multimeter to measure the voltage across our resistor and obtained approximately 50mV, which confirmed both our wiring and the expected 10mV/A ratio.
Finally, running our unified Python program, the Agilent DAQ successfully retrieved these exact same measurements automatically.
The testbench is now fully functional, capable of managing both Twist boards simultaneously and logging the data automatically! Thank you to everyone for following along with this project.
Here is the final script using this example “https://github.com/owntech-foundation/examples/tree/main/TWIST/Communication/python_comm_library“ :
import sys
import os
sys.path.append(os.path.abspath("."))

from owntech.lib.USB.comm_protocol.src import find_devices
from  owntech.lib.USB.comm_protocol.src.Shield_Class import Shield_Device
import time
import matplotlib.pyplot as plt
import matplotlib.animation as animation
import os
import pyvisa
from agilent import Agilent34970A
import time
import xmlrpc.client as xml
import time
import matplotlib.pyplot as plt
import numpy as np

os.add_dll_directory(r"C:\Program Files\Keysight\IO Libraries Suite\bin")

# Use Keysight VISA explicitly for 82357A.
rm = pyvisa.ResourceManager(r"C:\Windows\System32\agvisa32.dll")
print("Loaded VISA:", rm.visalib.library_path)
print("Resources:", rm.list_resources())

inst = rm.open_resource("GPIB0::10::INSTR")
inst.timeout = 5000
inst.write_termination = "\n"
inst.read_termination = "\n"
dmm = Agilent34970A(inst, channels={"Vres": "105"}, tc_type="V")

frame_limit = 100       # Nombre de points affichés sur l'axe X (largeur de la fenêtre)
reference = 5.0         # Consigne de départ (en Volts)
ref_step = 0.5          # Incrément de la consigne à chaque frame
ref_max_value = 10.0    # Valeur maximale de la consigne
ref_base_value = 5.0    # Valeur de retour quand le maximum est atteint

leg_to_test = "LEG1"                               #leg to be tested in this script
reference_names = ["V1","V2","VH","I1","I2","IH"]  #names of the sensors of the board

shield_vid = 0x2fe3
shield_pid = 0x0101
Shield_ports = (find_devices.find_shield_device_ports(shield_vid, shield_pid, 2))

# Sécurité : vérifier qu'on a bien au moins 2 cartes
if len(Shield_ports) < 2:
    print(f"Erreur : Seulement {len(Shield_ports)} carte(s) détectée(s). Branchez la deuxième !")
    sys.exit()

print(f"Cartes détectées sur les ports : {Shield_ports[0], Shield_ports[1]}")

# Création des deux objets distincts
Shield1 = Shield_Device(shield_port=Shield_ports[0])
Shield2 = Shield_Device(shield_port=Shield_ports[1])

# --- Configuration du graphique pour 2 cartes (4 courbes) ---
fig, ax = plt.subplots()
line1_b1, = ax.plot([], [], lw=2, label='Carte 1 - V1')
line2_b1, = ax.plot([], [], lw=2, label='Carte 1 - V2')
line1_b2, = ax.plot([], [], lw=2, linestyle='--', label='Carte 2 - V1')
line2_b2, = ax.plot([], [], lw=2, linestyle='--', label='Carte 2 - V2')

xdata = []
ydata1_b1, ydata2_b1 = [], []
ydata1_b2, ydata2_b2 = [], []

ax.set_xlim(0, frame_limit)
ax.set_ylim(0, 14)
ax.legend(loc='upper right')
ax.set_title('Real-time Plot - 2 Cartes OwnTech')

# Function to initialize the plot
def init():
    line1_b1.set_data([], [])
    line2_b1.set_data([], [])
    line1_b2.set_data([], [])
    line2_b2.set_data([], [])
    return line1_b1, line2_b1, line1_b2, line2_b2

def update(frame):
    global reference

    if frame == frame_limit:
        xdata.clear()
        ydata1_b1.clear()
        ydata2_b1.clear()
        ydata1_b2.clear()
        ydata2_b2.clear()
        ax.set_xlim(frame, frame + frame_limit)
    else:
        xdata.append(frame)

        reference = reference + ref_step
        if reference >= ref_max_value:
            reference = ref_base_value

        # --- Envoi des consignes ---
        # Carte 1
        Shield1.sendCommand("REFERENCE", "LEG1", "V1", reference)
        Shield1.sendCommand("REFERENCE", "LEG2", "V2", reference)
        # Carte 2
        Shield2.sendCommand("REFERENCE", "LEG1", "V1", reference)
        Shield2.sendCommand("REFERENCE", "LEG2", "V2", reference)

        time.sleep(10e-3) # Pause de stabilité

        # --- Mesures ---
        # Carte 1
        ydata1_b1.append(Shield1.getMeasurement('V1'))
        ydata2_b1.append(Shield1.getMeasurement('V2'))
        # Carte 2
        ydata1_b2.append(Shield2.getMeasurement('V1'))
        ydata2_b2.append(Shield2.getMeasurement('V2'))

        # --- Mise à jour du plot ---
        line1_b1.set_data(xdata, ydata1_b1)
        line2_b1.set_data(xdata, ydata2_b1)
        line1_b2.set_data(xdata, ydata1_b2)
        line2_b2.set_data(xdata, ydata2_b2)

    return line1_b1, line2_b1, line1_b2, line2_b2


# ---------------HARDWARE IN THE LOOP PV EMULATOR CODE ------------------------------------
message1 = Shield1.sendCommand("IDLE")
message1 = Shield2.sendCommand("IDLE")
message1 = Shield1.sendCommand("REFERENCE","LEG1","I1",5)
# message1 = Shield1.sendCommand("REFERENCE","LEG2","V2",5)
message1 = Shield2.sendCommand("REFERENCE","LEG1","V1",10.0)
# message1 = Shield2.sendCommand("REFERENCE","LEG2","V2",5)
message = Shield1.sendCommand( "BUCK", "LEG1", "ON")
message = Shield2.sendCommand( "BUCK", "LEG1", "ON")
message = Shield1.sendCommand("POWER_OFF")
message = Shield2.sendCommand("POWER_OFF")
message = Shield1.sendCommand("LEG","LEG1","OFF")
message = Shield2.sendCommand("LEG","LEG1","OFF")
input()
print("Activation shield2 - source de tension")
message = Shield2.sendCommand("POWER_ON")
message = Shield2.sendCommand("LEG","LEG1","ON")
input()
print("Activation shield1 - source de courant")
message = Shield1.sendCommand("POWER_ON")
message = Shield1.sendCommand("LEG","LEG1","ON")

time.sleep(2)
print(dmm.read_voltage_volts("Vres"))
for label, value in dmm.read_all_voltages_volts().items():
        print(label, value)
        time.sleep(1)

dmm.close()
input()
print("Fin mesure")

message = Shield1.sendCommand("POWER_OFF")
message = Shield2.sendCommand("POWER_OFF")
This is what we successfully accomplished this week. While there is still room for improvement and we haven’t yet finalized a full script to test every possible value, we have built a strong foundation for future work. Thank you for reading.